
For my capstone project in 2019, I independently designed a multimedia story exploring the significance and impact of the historic number of women elected in 2018. It resulted in two written pieces, data visualizations to highlight how historic the elections were, and a timeline documenting women’s participation in American politics.
Written piece one:
After 2018: how more elected women will affect the future of American government
Excerpt:
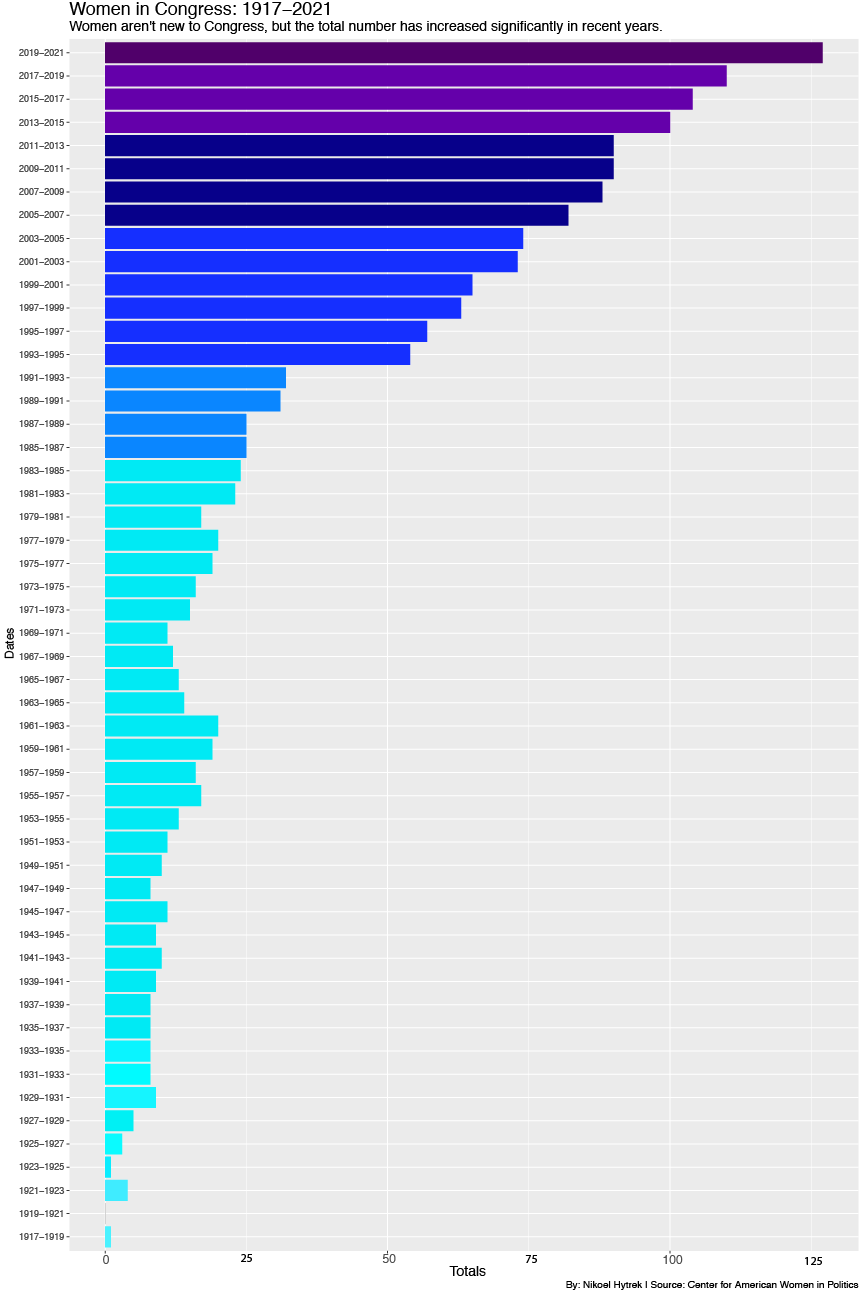
To put it in perspective, the 113th Congress elected in 2012 was the first with 100 women, the 112th had 90. It wasn’t until 1993 that the total number of women in Congress reached 50.
But the question is: how will this new balance affect the country? (full story on Medium)
Written piece two:
Behind the scenes of getting women elected to office
Excerpt:
A record-setting 127 women hold elected office in the 116th Congress.
This is because more women made the decision to run in the first place, but most women need someone to suggest the idea in the first place.
This is an area where political organizations and the major parties have a chance to play a role. (full story on Medium)
Representation by the Numbers
A series of data visualizations displaying the significance of the number of women elected to office and the work that’s left to do. Sample:
(more on Medium)
Timeline of women’s political involvement in America
This is an interactive timeline documenting the history of women being political in the United States. It documents artifacts like Abigail Adams’ “Remember the Ladies” letter, society-changing periods like the Temperance Movement and labor strikes all the way to Hillary Clinton’s candidacy.
